

W&B LEET (Lightweight Experiment Exploration Tool) is a keyboard-driven terminal UI for exploring runs logged on the machine where you work. Use LEET to compare metrics, inspect system utilization, browse logged images, and tail console output without opening a browser. LEET reads localDocumentation Index
Fetch the complete documentation index at: https://wb-21fd5541-docs-2632.mintlify.app/llms.txt
Use this file to discover all available pages before exploring further.
.wandb transaction logs, so you can inspect runs before they sync to the cloud.
When to use LEET
LEET is built for engineers who spend most of their time in a terminal, especially on remote machines, clusters, or SSH sessions where a graphical browser is slow or unavailable.| Surface | Best for |
|---|---|
| LEET | Local run folders on the machine that logged them; fast keyboard navigation; live monitoring while a job is still writing logs; SSH and tmux workflows. |
| W&B App | Full project workspaces, team collaboration, reports, sweeps, artifacts, and rich panel types across synced cloud runs. |
| W&B mobile app | Lightweight monitoring and alerts for synced cloud projects on a phone (Multi-tenant Cloud only). |
Prerequisites
Install or upgrade the W&B CLI. LEET requireswandb-core and ships with the CLI package.
0.23.0. Multi-run workspaces, the config editor, SYMON, media panes, and unified pane navigation require newer releases. For the features described on this page, use CLI 0.26.0 or later.
Verify that wandb-core is available:
wandb so the bundled core binary is present.
wandb beta leet is a beta command. Its flags, shortcuts, and behavior may change between releases. The SDK team plans to graduate LEET out of wandb beta; watch SDK release notes for updates.Launch LEET
From the directory that contains yourwandb/ folder, open the default workspace for the latest local run:
.wandb file:
wandb beta leet run accepts the same optional PATH argument and launches the same TUI.
Open the standalone system monitor (SYMON) when you need host metrics without a run context:
wandb beta leet in the CLI reference.
Views and pane layout
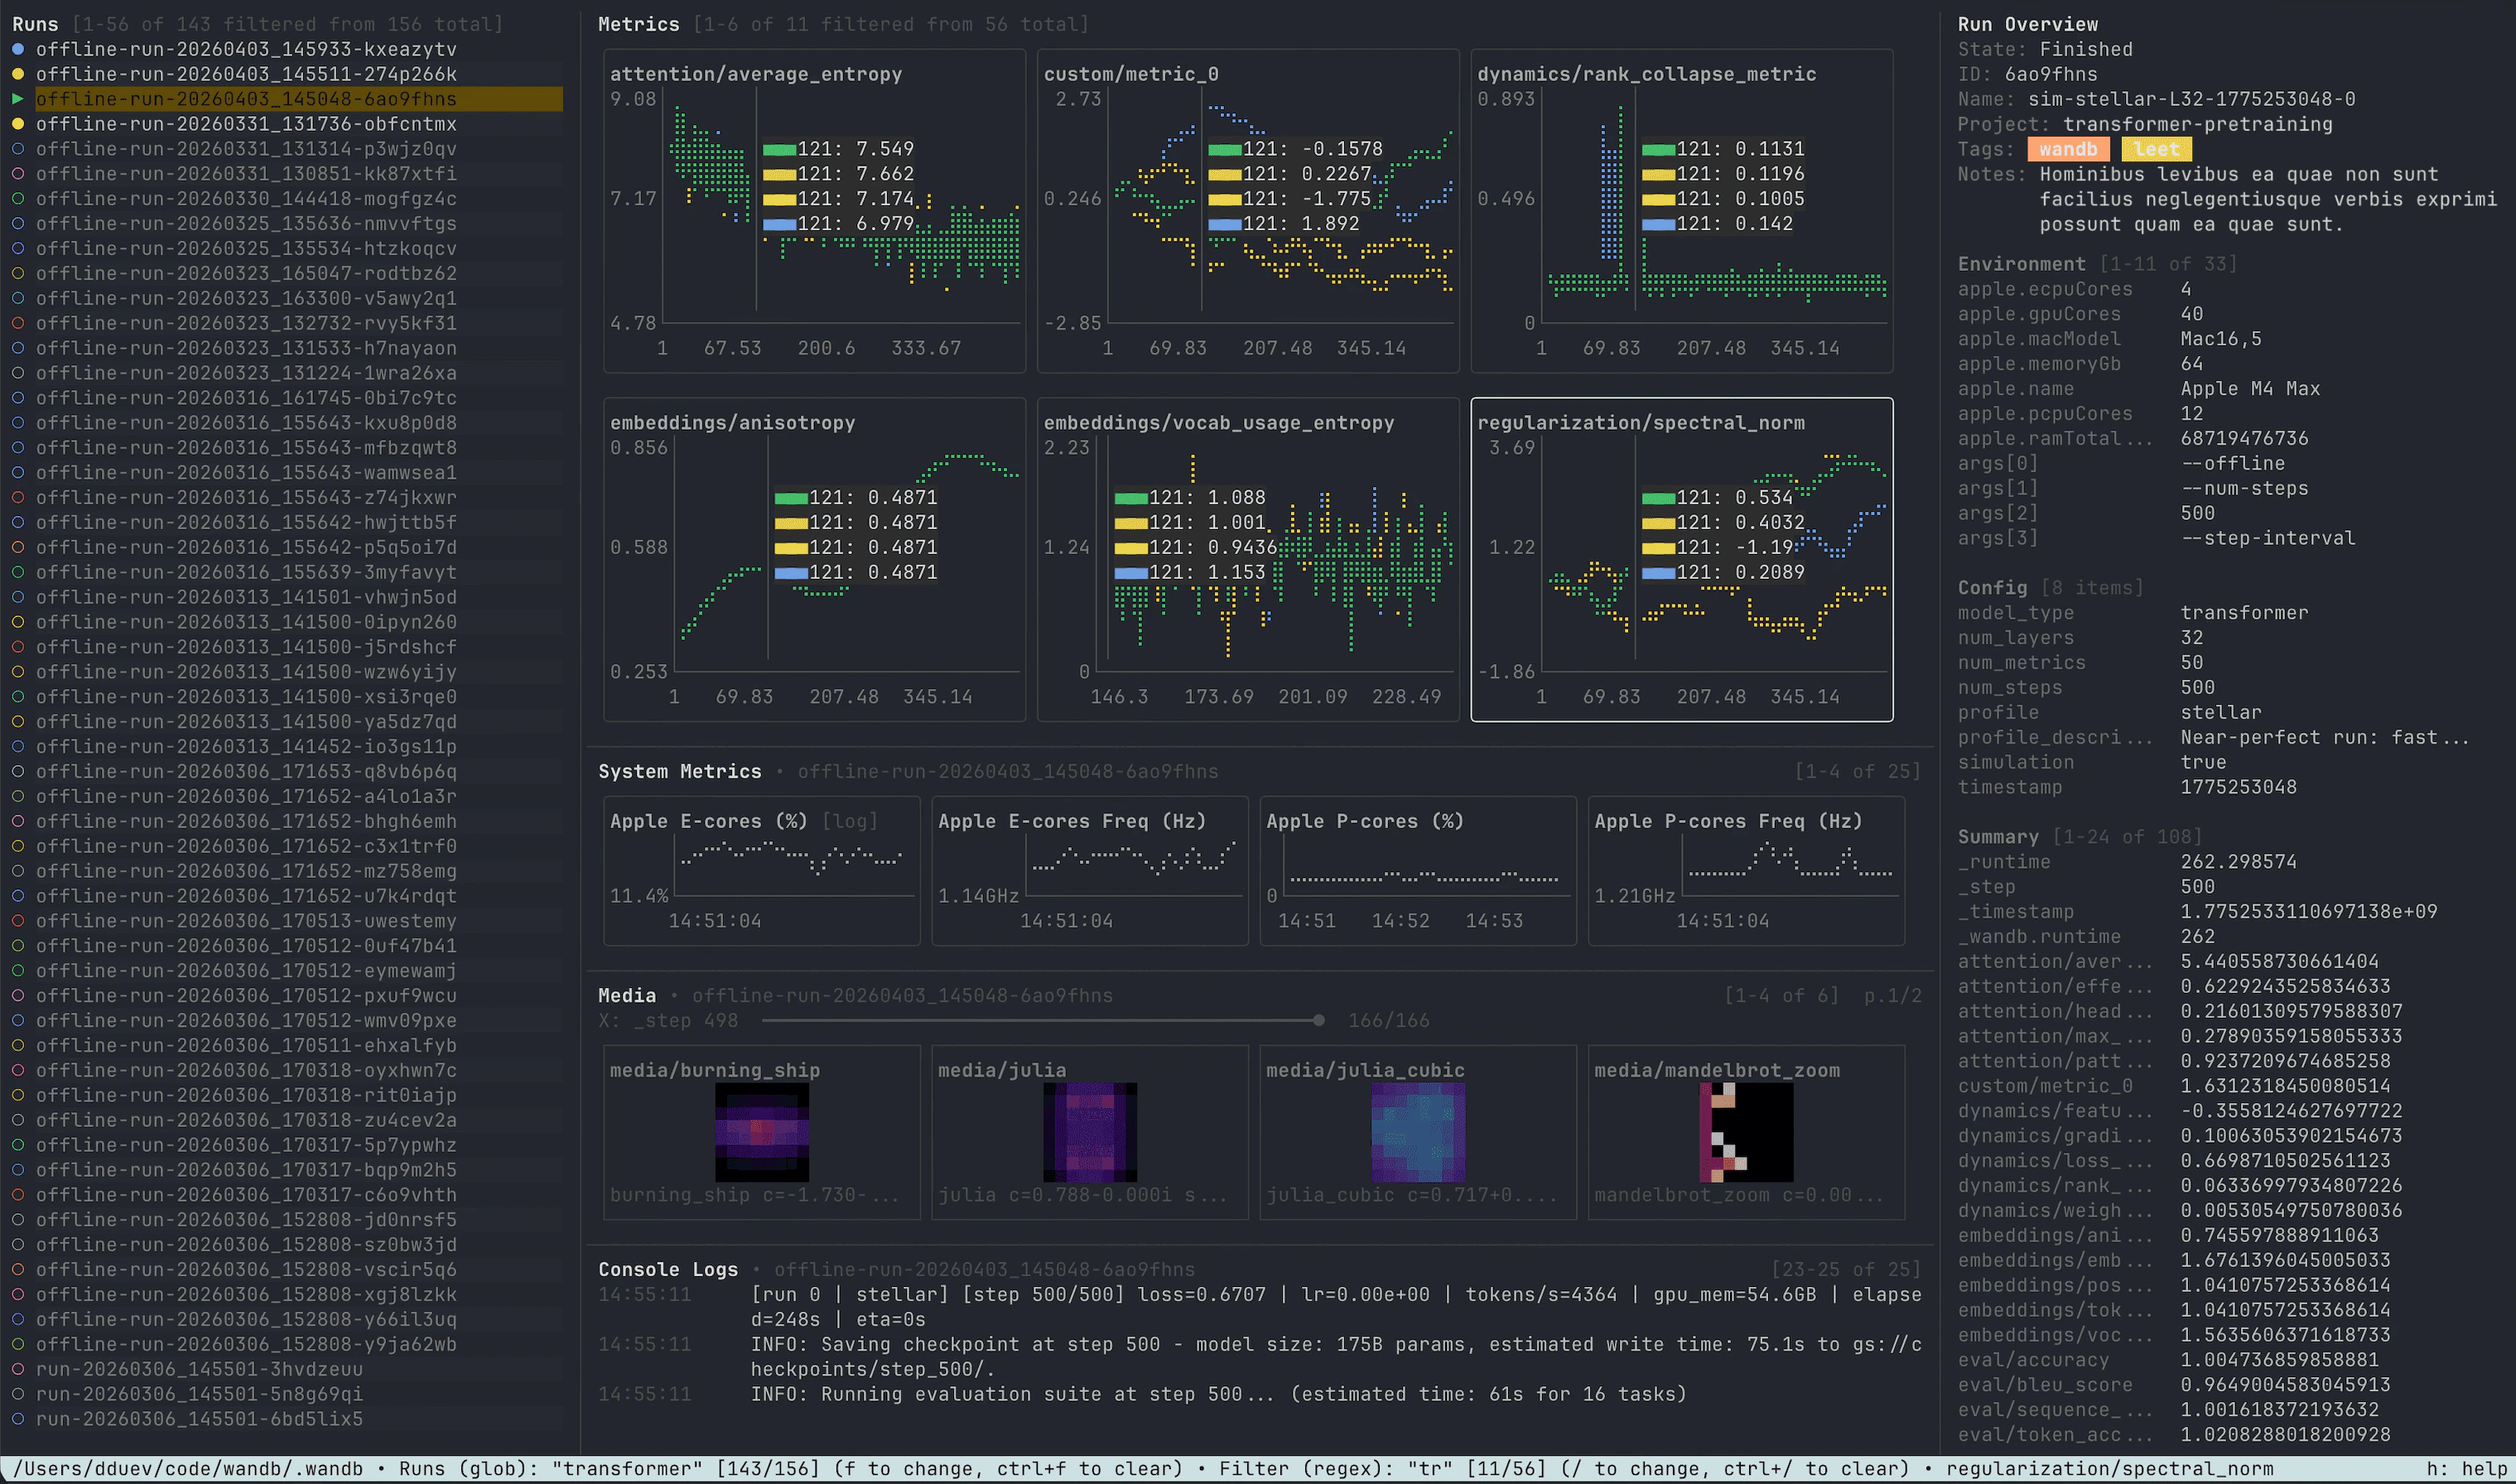
LEET has three main views: workspace, single-run, and SYMON.Workspace view
Workspace view is the default. It is designed to compare multiple runs from the same localwandb/ directory.
Typical panes include:
- Runs sidebar — browse and filter local run folders.
- Metrics grid — overlay selected runs on the same scalar charts.
- System metrics — charts for the highlighted run.
- Media —
wandb.Imagethumbnails rendered in the terminal. - Console logs — assembled stdout and stderr for the highlighted run.
- Run overview — state, IDs, tags, notes, config, and summary values.
space to select or deselect a run for overlaid metrics. Use p to pin a run so its series stays on top in metric charts. Press enter on the highlighted run to open single-run view. Live runs keep updating in the workspace, so you can use LEET for both post-run analysis and monitoring an active job.
Single-run view
Single-run view focuses on one run with a metrics grid in the center, run overview on the left, and system metrics on the right. Media and console log panes open below the metrics grid when toggled on.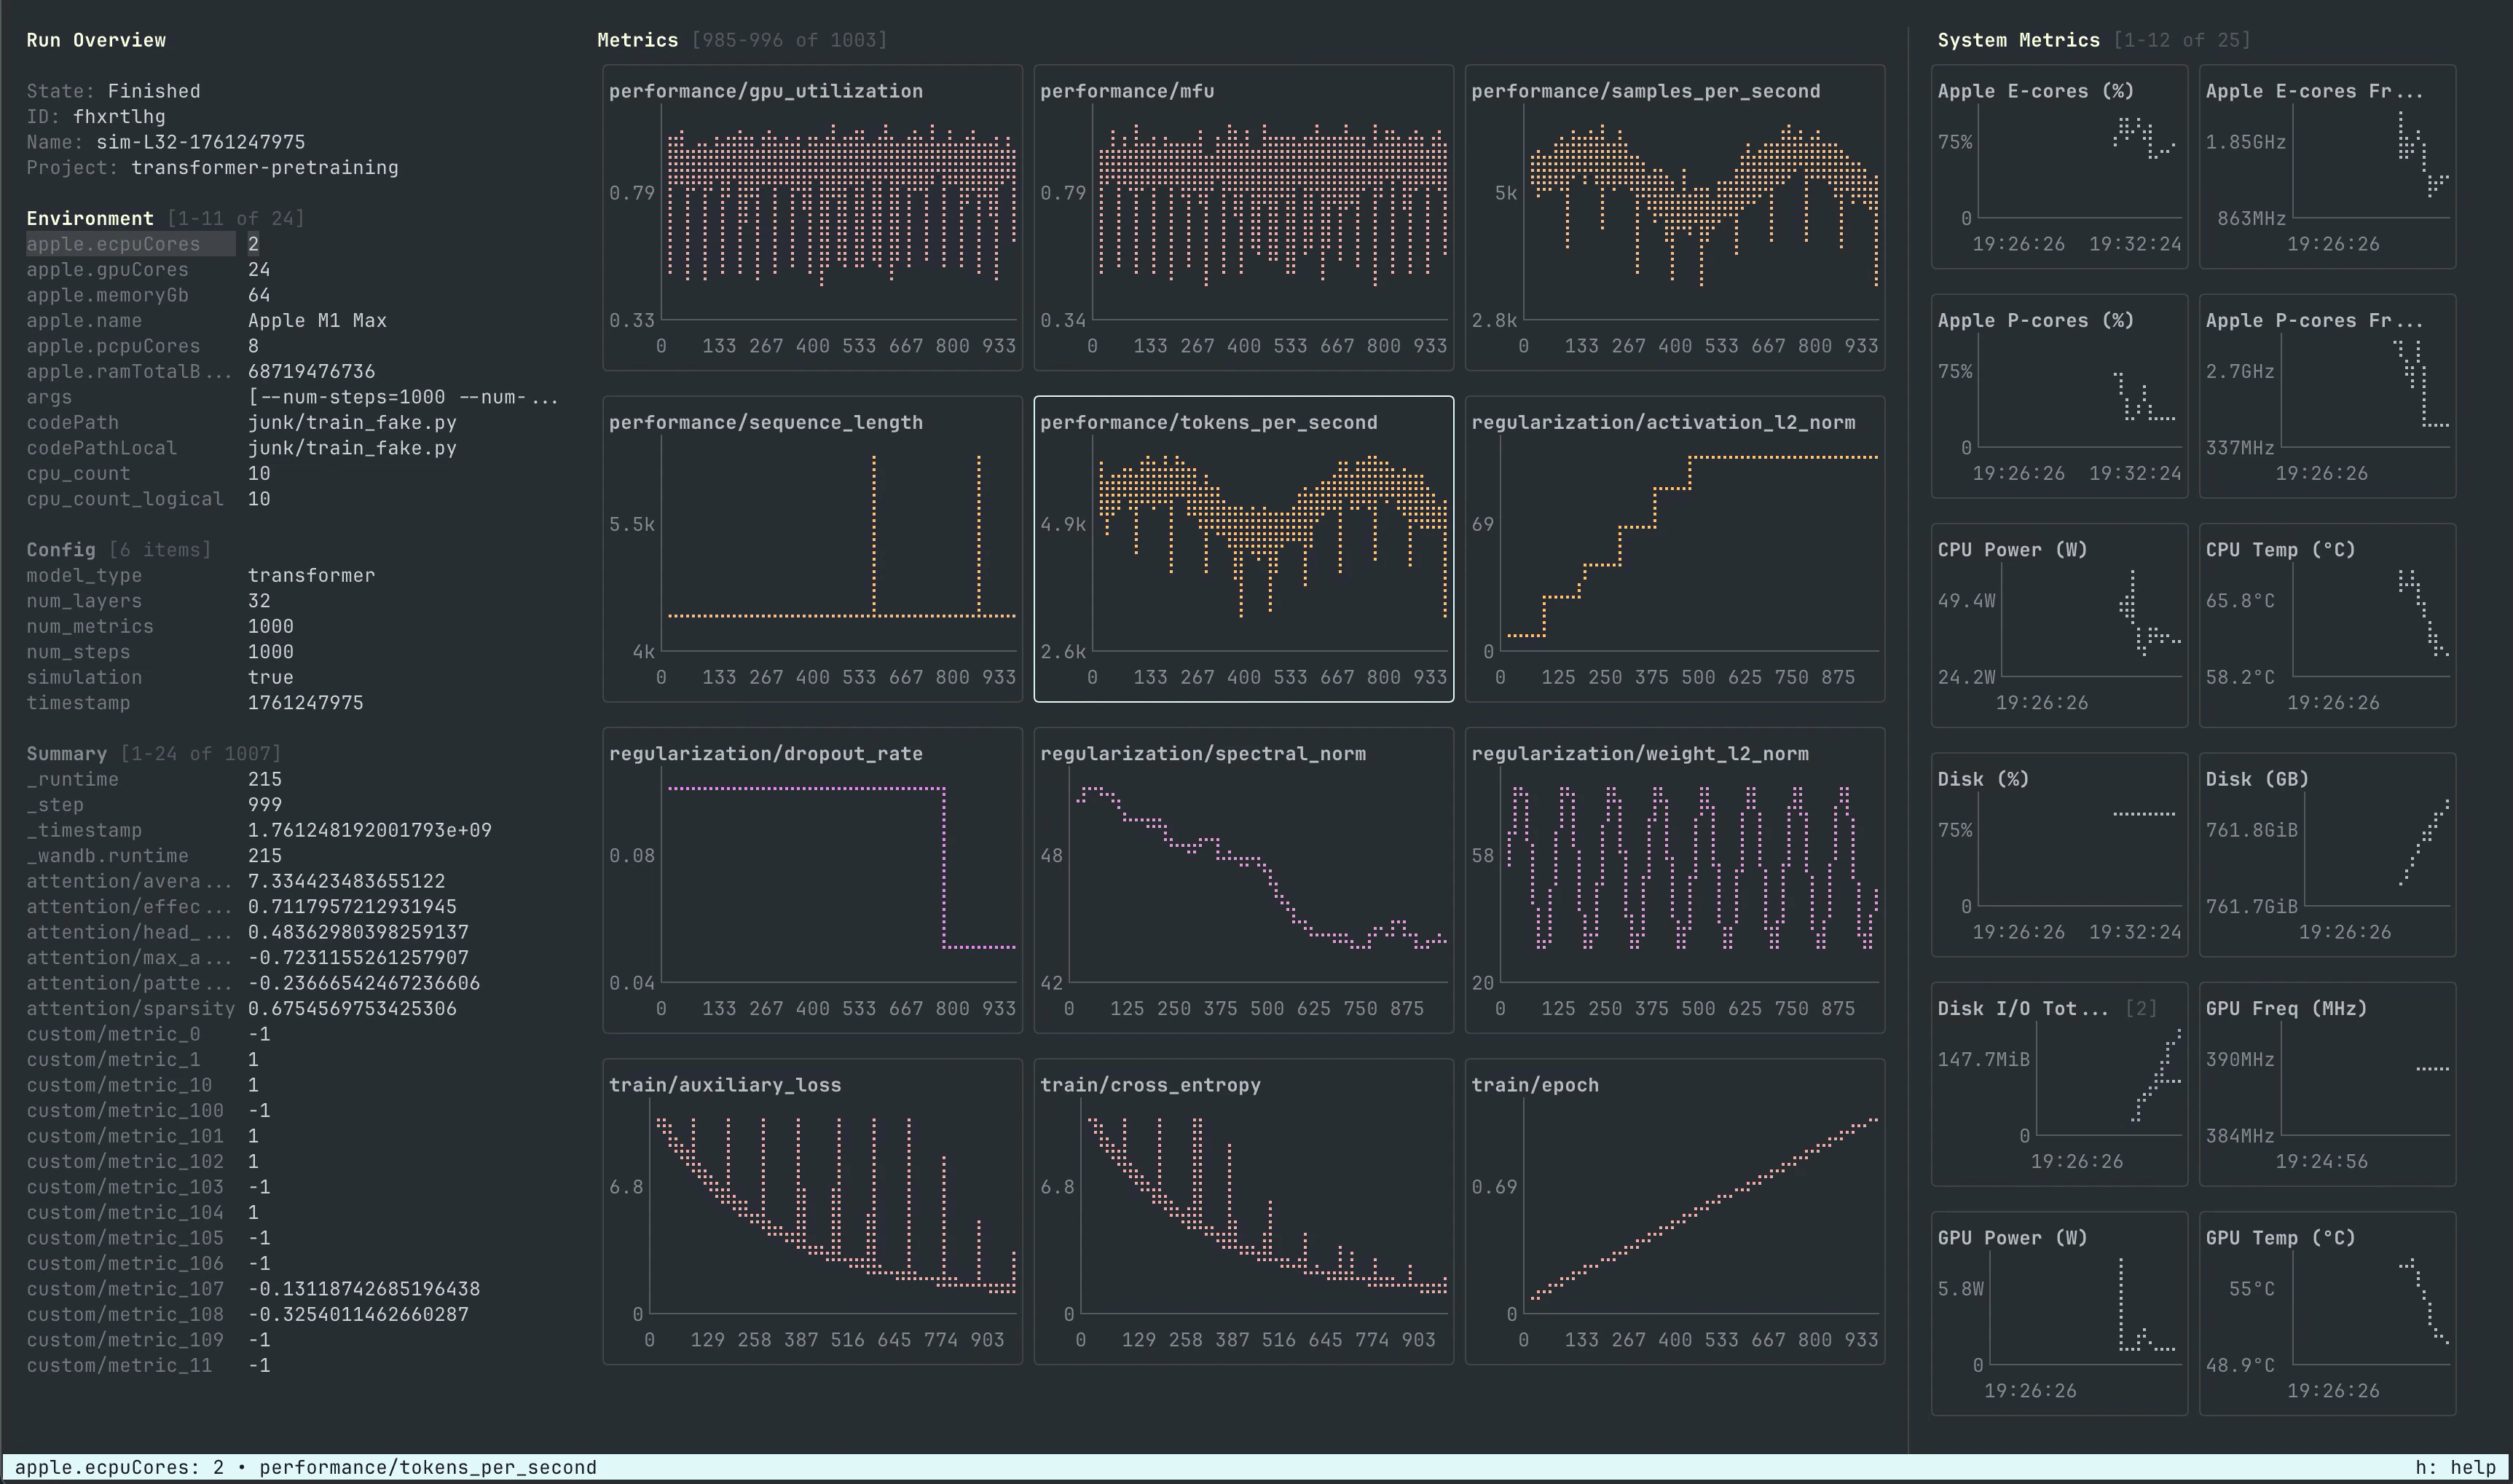
esc to return to workspace view.
SYMON
SYMON watches local CPU, memory, disk, network, and accelerator metrics while another process runs. It uses the same chart engine as run-backed system metrics panes but is not tied to a W&B run file.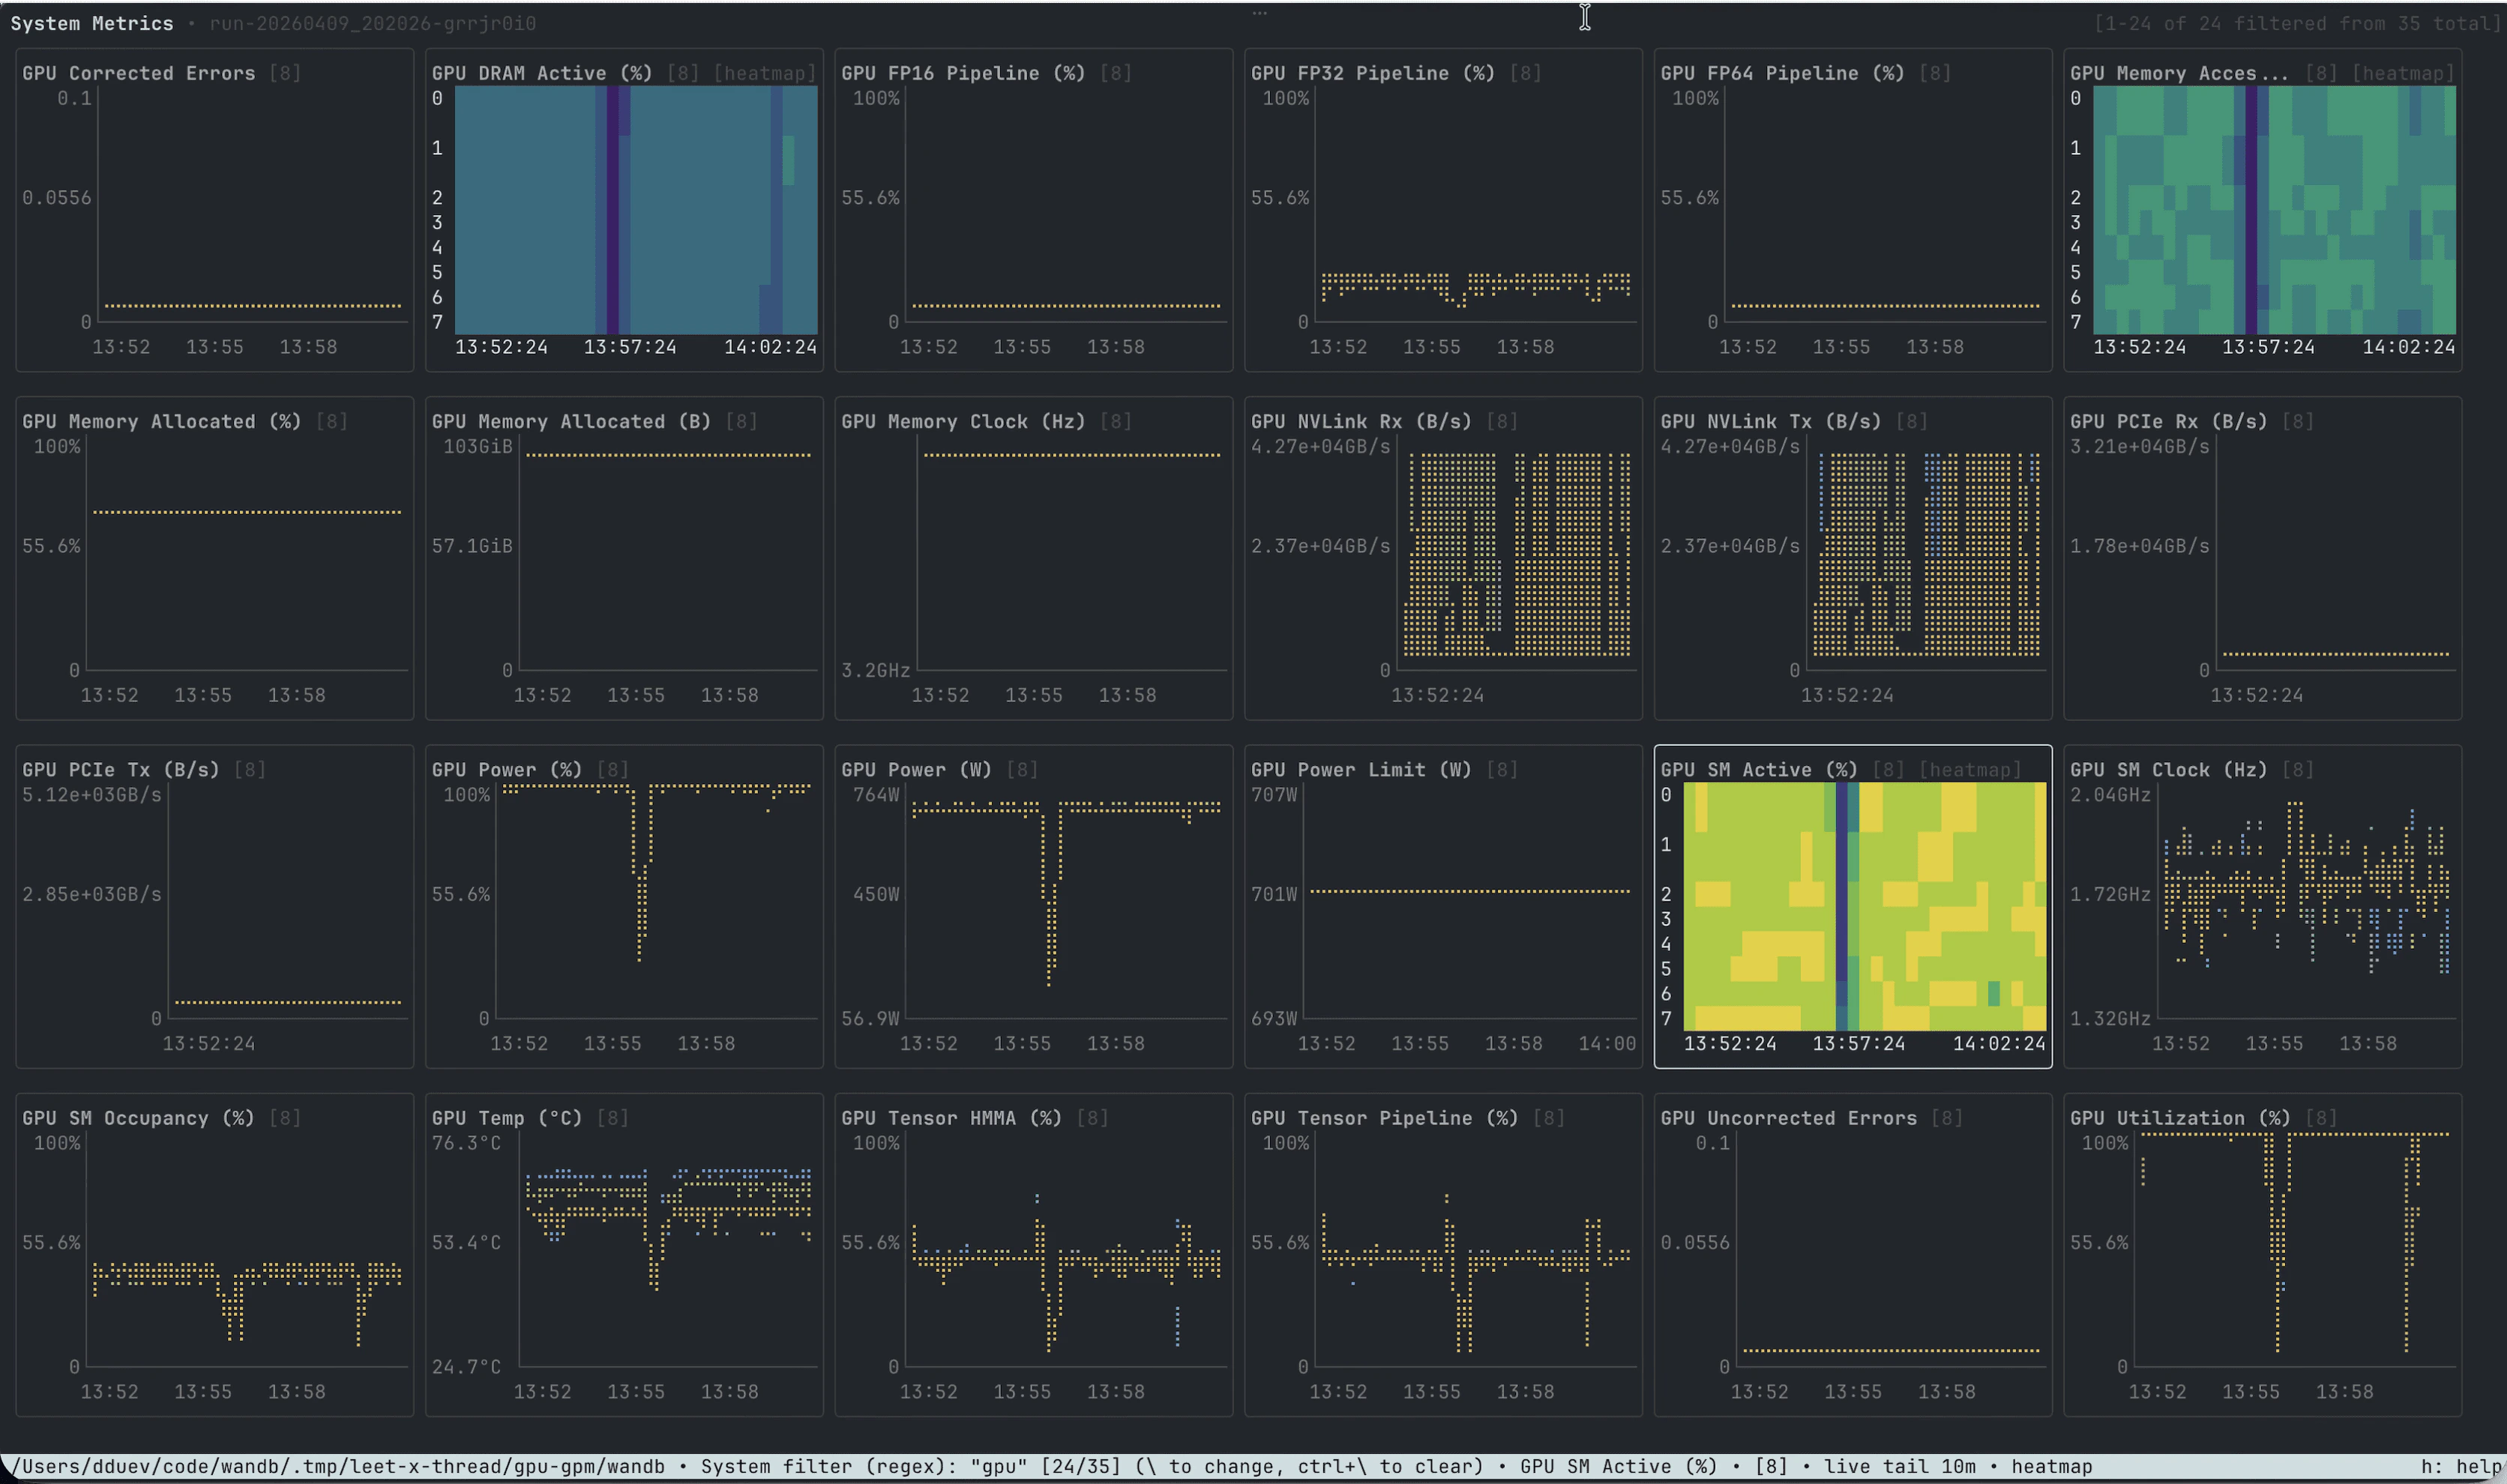
Key features
Multi-run comparison
Select multiple runs in workspace view to compare scalar metrics on shared charts. Each run gets a stable color, and LEET reduces base color collisions so overlaid series stay distinguishable. Pinning is useful when many runs are selected and you want one series to render above the rest. Pressf to filter the runs list by name, project, tags, notes, config values, and other metadata. See the wandb beta leet reference for the full query syntax.
Metrics and system metrics
LEET renders scalar metrics as terminal line charts. Filter run metrics with/ and system metrics with \. Press y on a focused chart to cycle modes such as log-scale Y or bucketed heatmap views for percentage-based system metrics.
Use the mouse wheel to zoom the focused chart. On live system metric charts, LEET defaults to a rolling tail window (10 minutes by default). Right-click and drag on a chart to inspect the nearest point. Hold alt while dragging to inspect all visible charts at the same X position.
Media and console logs
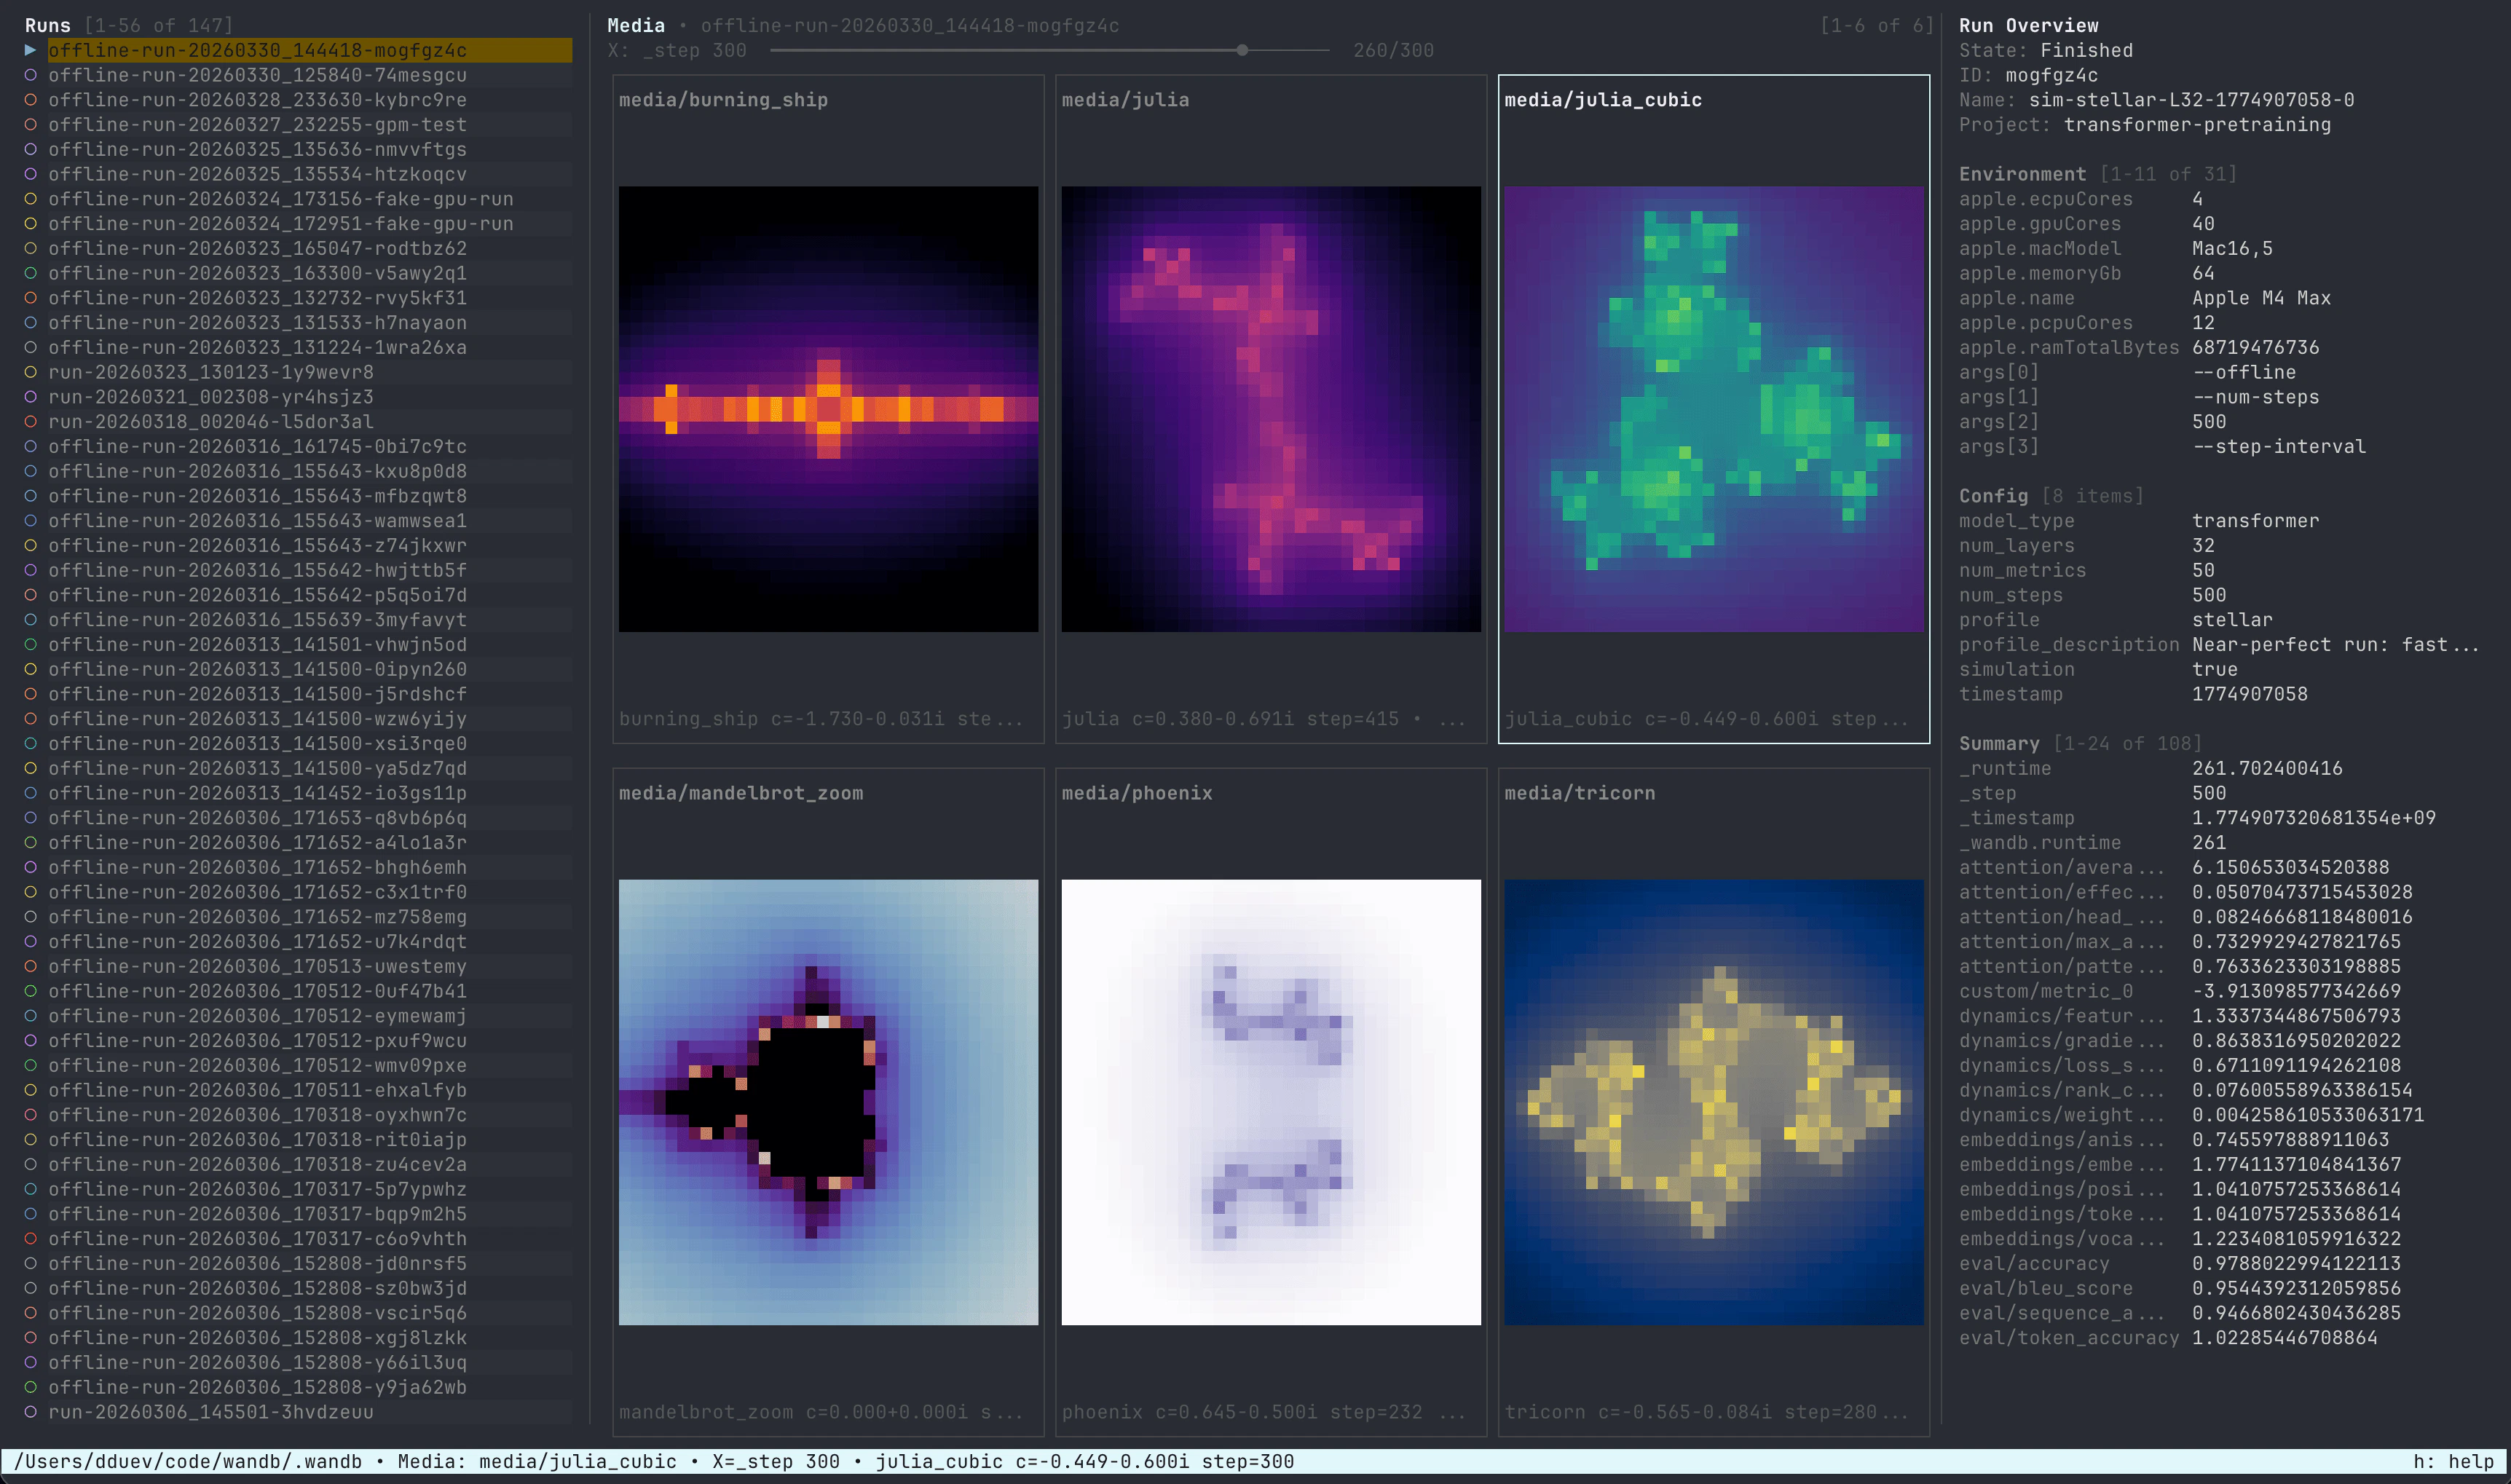
The media pane showswandb.Image series as ANSI thumbnails. Toggle it with 3 in workspace or single-run view.
4. LEET rebuilds readable log lines from raw terminal output, including ANSI escape codes and carriage-return progress lines.
For console log behavior in the W&B App, see Console logs.
Configuration
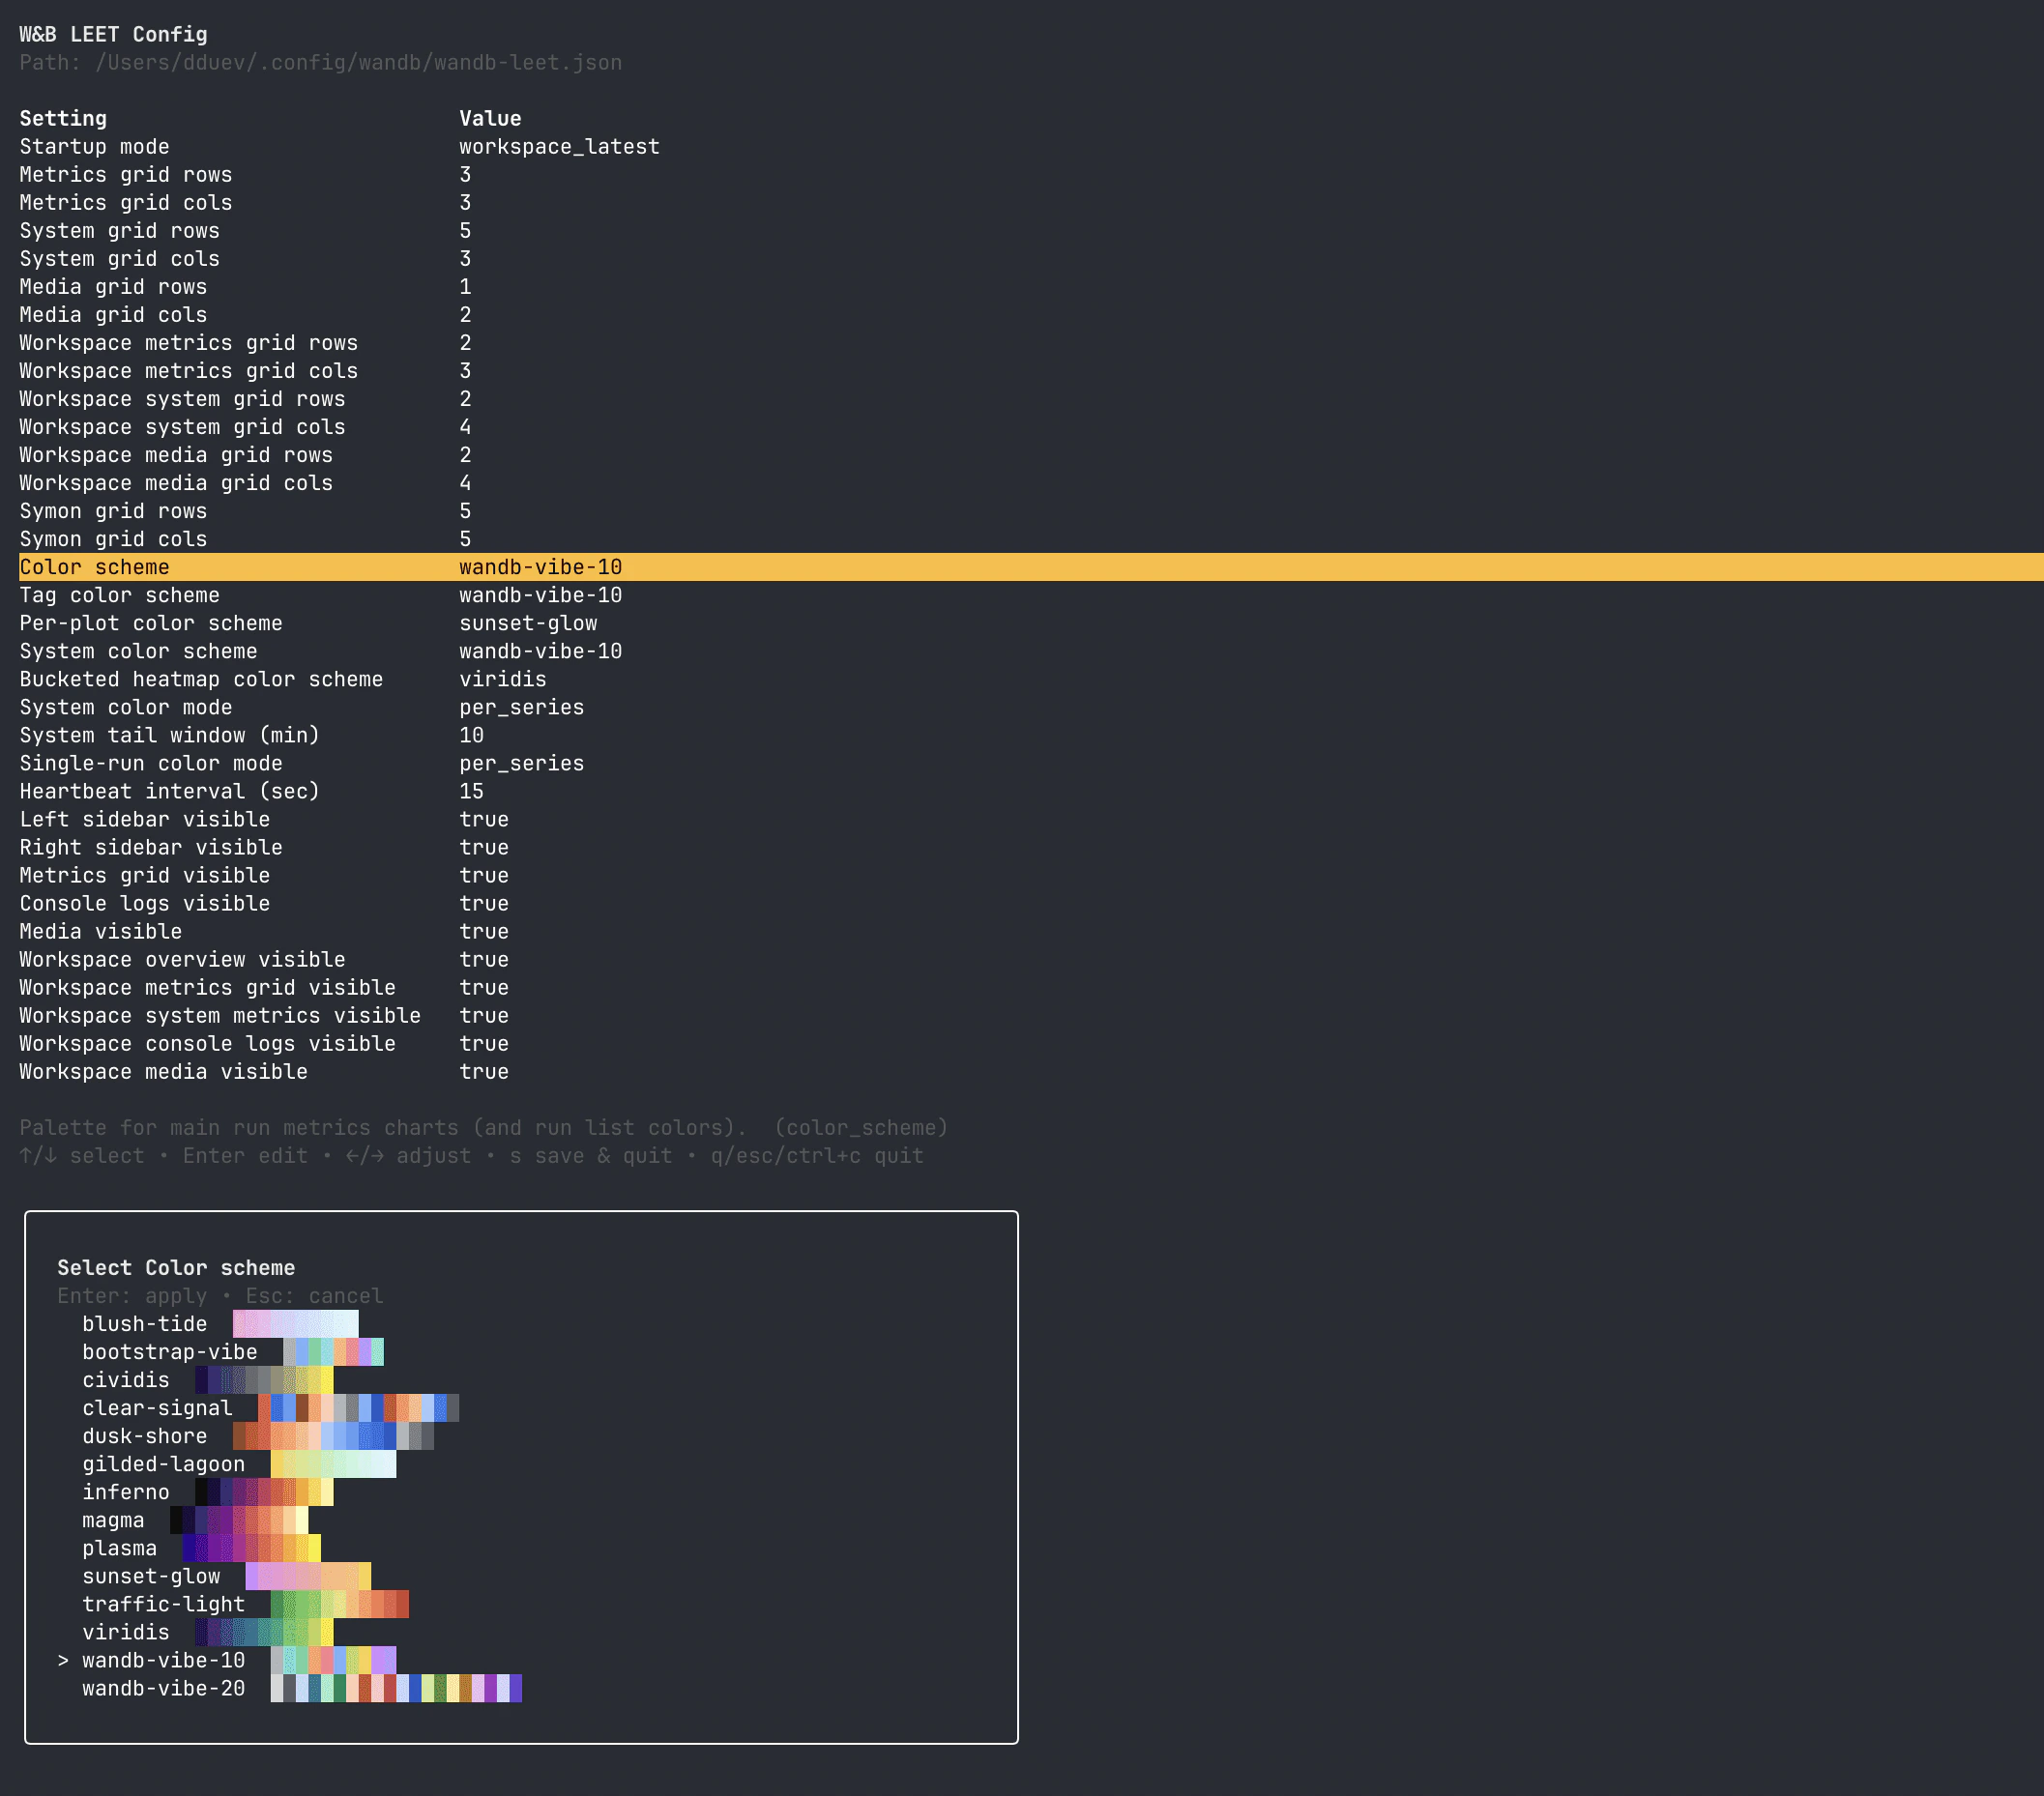
Persist layout, colors, default panes, and startup mode with the config editor:wandb-leet.json under ~/.config/wandb/ by default, or under WANDB_CONFIG_DIR when that variable is set. You can also resize grids from inside LEET with c and r.
Navigate with the keyboard
LEET is designed for keyboard and mouse input. Pressh or ? inside LEET to open the in-app help overlay for the current view.
Across workspace and single-run views:
tabandshift+tabcycle focus between visible panes.w,a,s,dand the arrow keys move within the focused pane (except in the media pane, where arrows scrub the X-axis and WASD moves between tiles).home,end,pgup, andpgdownjump within lists, chart pages, or media frames.1,2,3, and4toggle the metrics grid, system metrics, media, and console logs panes.[and]toggle sidebars (runs list, run overview, or system metrics depending on the view).
wandb beta leet.
Limitations compared to the W&B App
LEET complements the W&B App but does not replicate every workspace capability.| Capability | LEET | W&B App |
|---|---|---|
| Data source | Local wandb/ directories and .wandb files on the current machine | Synced cloud projects and teams |
| Run comparison | Multiple local runs in one directory | Full workspace tables, grouping, and saved views |
| Panel types | Scalar line charts, system metrics, wandb.Image media, console logs | Line, bar, scatter, parallel coordinates, media, code, query panels, custom charts, and more |
| Collaboration | Single-user terminal session | Sharing, comments, reports, and team features |
| Artifacts and files | Not available | Artifacts, Files, and Code tabs per run |
| Sweeps and registry | Not available | Sweep dashboards, registry, and automations |
Related resources
- View a specific run — open runs in the W&B App or LEET.
- Keyboard shortcuts — LEET and App shortcut reference.
wandb beta leet— launch syntax, filtering, configuration keys, and changelog.- SDK release notes — LEET feature history by CLI version.